First, I should explain my absence…I’ve become temporarily disabled by a broken foot. To those who know my alternate life, no, it was not from playing hockey (although if it was, at least I’d have been having fun breaking it). Simply missing a step on the stairway in our house led to the loss of my hockey season, spending upwards or $1500 (after insurance), and missing at least two weeks of work. Now, back to our regular broadcast.
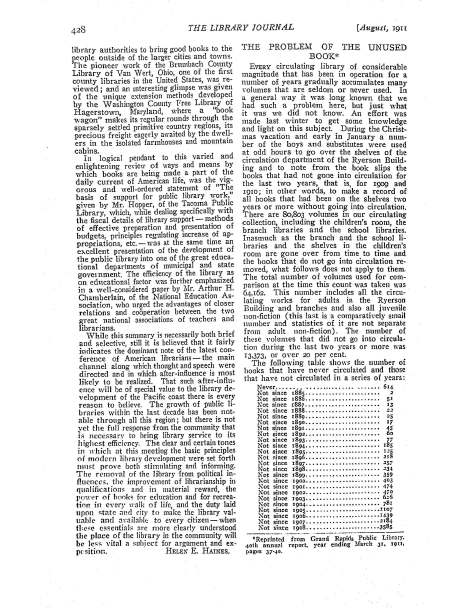
I am trying to write a literature about the analysis of book circulation data for an article that will focus on the distribution of book circulations. When I write literature reviews, I like to try to find temporal trends in research on whatever topic it is – I think it enables me to put the research into context. In my literature searching, I came across this article:
Problem of the unused book.(1911). Library Journal (1876)., 36, 428-429.
So, even as far back as 1911, librarians were concerned about this problem. I am constantly amazed at how little in our field has really changed. Not even the solutions are much different – display “dying” books to regenerate interest, and put “dead” books into storage.
This article is intriguing because it includes a breakdown by year last used. I’ve attempted to supplement the analysis, reversing the years since last year used to provide a different perspective.
| Last Used | Num. Titles | Cumulative Total | % of Not Used | Cum. % of Not Used | % of All Titles | Cum. % of All Titles |
| 1908 | 3585 | 3585 | 26.8% | 26.8% | 5.59% | 5.59% |
| 1907 | 2184 | 5769 | 16.3% | 43.1% | 3.40% | 8.99% |
| 1906 | 1439 | 7208 | 10.8% | 53.9% | 2.24% | 11.23% |
| 1905 | 1107 | 8315 | 8.3% | 62.1% | 1.73% | 12.96% |
| 1904 | 781 | 9096 | 5.8% | 68.0% | 1.22% | 14.18% |
| 1903 | 626 | 9722 | 4.7% | 72.6% | 0.98% | 15.15% |
| 1902 | 480 | 10202 | 3.6% | 76.2% | 0.75% | 15.90% |
| 1901 | 474 | 10676 | 3.5% | 79.8% | 0.74% | 16.64% |
| 1900 | 403 | 11079 | 3.0% | 82.8% | 0.63% | 17.27% |
| 1899 | 359 | 11438 | 2.7% | 85.5% | 0.56% | 17.83% |
| 1898 | 234 | 11672 | 1.7% | 87.2% | 0.36% | 18.19% |
| 1897 | 237 | 11909 | 1.8% | 89.0% | 0.37% | 18.56% |
| 1896 | 218 | 12127 | 1.6% | 90.6% | 0.34% | 18.90% |
| 1895 | 125 | 12252 | 0.9% | 91.5% | 0.19% | 19.10% |
| 1894 | 185 | 12437 | 1.4% | 92.9% | 0.29% | 19.38% |
| 1893 | 77 | 12514 | 0.6% | 93.5% | 0.12% | 19.50% |
| 1892 | 60 | 12574 | 0.4% | 94.0% | 0.09% | 19.60% |
| 1891 | 45 | 12619 | 0.3% | 94.3% | 0.07% | 19.67% |
| 1890 | 37 | 12656 | 0.3% | 94.6% | 0.06% | 19.73% |
| 1889 | 25 | 12681 | 0.2% | 94.8% | 0.04% | 19.76% |
| 1888 | 22 | 12703 | 0.2% | 94.9% | 0.03% | 19.80% |
| 1887 | 13 | 12716 | 0.1% | 95.0% | 0.02% | 19.82% |
| 1886 | 51 | 12767 | 0.4% | 95.4% | 0.08% | 19.90% |
| 1885 | 2 | 12769 | 0.0% | 95.4% | 0.00% | 19.90% |
| Never | 614 | 13383 | 4.6% | 100.0% | 0.96% | 20.86% |
| Total | 13,383 | 4.0% | 20.86% |
So…21% (13,383 titles) of the collection (n=64,162) had not been used in the last 2 years. It is evident that the bulk of the unused titles are more recent, suggesting that it takes time for books to become noticed and used by patrons. The famous (infamous?) “Pittsburgh Study” tracked usage of books added the collection over five years. They found that 60% of these titles had not circulated over that same time period (Bulick, 1976). Based on the data above, the problem of time-in-collection is apparent. However, other research has clearly shown a decrease in the probability of use over time (Chen, 1976; Jain, et al. 1969).
What is not stated in the article above, however, is their weeding policies. Were they removing books that had not been used and were deemed undesirable to keep? The tone of the article suggests that they were not, that this was a novel assessment, indeed removing items entirely from the collection that were still in good shape was not even an option.
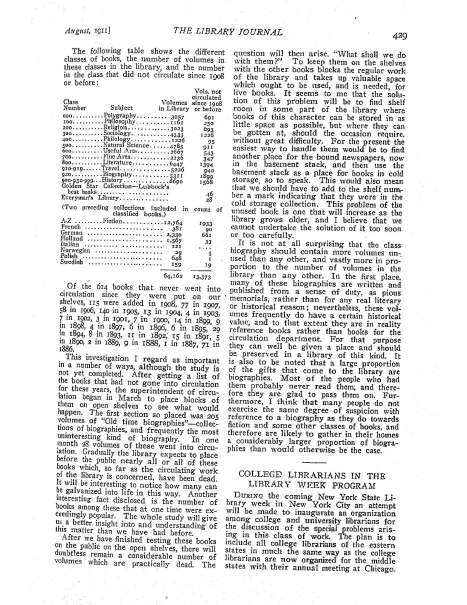
Interestingly, they even broke down usage by broad Dewey call number ranges:
| Class | Subject | Vols. In Library | Vols. not used in last two years | % Not Used |
| 000 | Polygraphy | 3057 | 691 | 22.60% |
| 100 | Philosophy | 1162 | 250 | 21.51% |
| 200 | Religion | 3023 | 693 | 22.92% |
| 300 | Sociology | 4333 | 1226 | 28.29% |
| 400 | Philology | 1226 | 95 | 7.75% |
| 500 | Natural Science | 4785 | 911 | 19.04% |
| 600 | Useful Arts | 2667 | 543 | 20.36% |
| 700 | Fine Arts | 2236 | 347 | 15.52% |
| 800 | Literature | 6447 | 1394 | 21.62% |
| 910-919 | Travel | 5226 | 940 | 17.99% |
| 920 | Biography | 5311 | 1899 | 35.76% |
| Other 900’s | History | 6690 | 1568 | 23.44% |
Their explanation for the high rate of disuse for biographies was their policy to collect titles “written and published from a sense of duty, as pious memorials, rather than for any real literary or historical reason…”. Generally, there appears to be a direct relationship between collection size and percent not used. Here’s the scatterplot of these two variables, with the regression formula for the linear trendline:
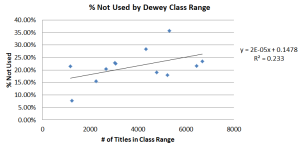
The effect (0.05) is modest, indicating that for every increase of titles in the collection, the percentage of disuse increases .05%, but the fit (R2) is also modest, explaining only about 23% of the variation. The correlation coefficient (R, not listed here) is 0.48, which is moderately strong. So it is clear that the size of the collection could have some effect on the usage, in that the fewer items there are, the lower rate of disuse. This conclusion should not be extended to the end of reducing ones collections. After all, if this were true, then you would not be seeing the explosion of choices available on retail shelves. There is more going on here than a simple cause-effect relationship.
Well, my tangent has come to an end. I am the more wiser to know that the library data has, indeed, been analyzed to explore such problems and derive solutions. It would be nice to see the data on the effects of their solutions.
References
Bulick, S. (1976). Use of library materials in terms of age. Journal of the American Society for Information Science, 27, 175-178.
Chen, C. (1976). Applications of operations research models to libraries : A case study of the use of monographs in the francis A. countway library of medicine, harvard university. Cambridge, Mass.: MIT Press.
Jain, A. K., Leimkuhler, F. F., & Anderson, V. L. (1969). A statistical model of book use and its application to the book storage problem. Journal of the American Statistical Association, 64(328), 1211-1224. Retrieved from http://www.jstor.org/stable/2286062.
NOTE: I’ve reproduced the article below for my readers’ reference. This article was published before 1925, and thus is in the public domain.

